Best Locations to Site Shopping Malls in Lagos & Venues Data Analysis of Lagos Neighbourhoods
Introduction
This blog post is part of the final capstone project for Coursera’s IBM Data Science Professional Certification. Through this article, I will be sharing the methods and techniques to solve a business problem with the help of data science.
We will begin with the following steps, necessary for any Data Science project:
- Business Problem
- Data Collection
- Methodology
- Results & Discussion
- Conclusion
Business Problem
Lagos is the most populous city in Nigeria and the African continent. Being an economic hub and major financial centre for all of Africa, Lagos has the fourth-highest GDP in Africa. Over 50% of Nigeria’s industrial capacity is located in Lagos, with a variety of manufactured goods being produced in the city, including electronic equipment, machinery, foodstuffs, beverages, and chemicals.
The retail sector in Nigeria is based on the latent potential of Nigeria’s population, consequently, placing Lagos as the hub of Nigeria’s retail market. Therefore, firms hoping to cater to that block of consumers in Lagos should explore innovative ways to reduce market friction and improve the shopping experience for the buyers.
Shopping malls can provide the best shopping experience and reduce the pressure on traditional markets which mostly lead to congestion of roads and public spaces. Moreso, improved business experience can foster social gatherings, entertainment, performances, product launches, promotions, and festivals.
By knowing which location is less clustered with shopping malls, investors and firms can easily make data-driven decisions when expanding their businesses within the state.
In this project, I tried to;
- Find an optimal location for a Shopping Mall in Lagos. Since there are a number of Shopping Malls in Lagos, I tried to detect locations that are already crowded with Shopping malls, which can then guide us to spot locations that are less condensed with Shopping malls.
- Explore business opportunities across Lagos Neighbourhoods by identifying top venues in Lagos and segmented the business activities within.
This project is particularly useful to property developers and investors looking to invest in new shopping malls or explore business opportunities in Lagos, Nigeria. This project is also viable as it has the potential to help the traffic congestion in the city.
2.0 Data Collection
To solve the problem, we will require the below-mentioned data:
- A list of LGA and neighborhoods in Lagos via Wikipedia defines the scope of this project which is confined to the city of Lagos.
- The coordinate of Lagos state to be obtained using Google Maps API reverse geocoding
- Python Geocoder package/Google map for latitude and longitude coordinates of the neighborhoods in order to plot the map and also to get the venue data.
- Foursquare API to get the venue data for the neighborhoods.
- Python Folium Package for Map Visualisation.
- Matplotlib for graphical visualization
Moreso, I used the k-means clustering algorithm to create emerging clusters for the neighborhoods with top venues.
3.0 Methodology
Import Lagos state data of LGA with their Neighbourhoods and Coordinates
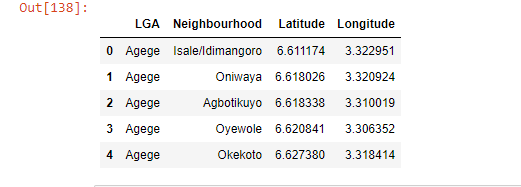
To do this, centers of popular neighbourhoods within each LGA was manually collated from google map and imported into pandas. The result was a dataframe with 196 rows. Below is is a screenshot of first five rows.

I used python folium library to visualize geographic details of Lagos and its neighbourhoods and I created a map of Lagos with neighbourhoods superimposed on top. I used latitude and longitude values to get the visual as below:

Explore the neighborhoods in our dataframe.
I utilized the Foursquare API to explore the neighborhoods and segment them. I designed the limit as 100 venue and the radius 1500 meter for each neighborhoods from their given latitude and longitude informations. The result returned by Foursquare gave us 1249 venues. Here is a head of the list from Forsquare API.

Explore the Shopping Malls in Lagos
I explored the shopping malls across Lagos neighbourhoods to enable me ascertain areas with shopping malls. The result returned by Foursquare API was 35 shopping malls spread across 25 neighbourhoods. Here is a head of the list.

I viewed the shopping malls using folium. The map will enable us see areas where there are deficiencies.

I performed further explanatory data analysis and derived some additional infomation from our shopping mall data. I viewed the shopping malls on a bar chart by the number present within each neighbourhood.

The table below corresponds with the data on the chart.

In addition to this project, I also explored and clustered top venues in Lagos to show what business opportunities are available
Explore & Cluster Top Lagos Venue Categories
I explored and clustered top venue categories across Lagos neighbourhoods. First, I grouped the neighbourhoods and sorted them based on neighbourhoods with top numbers of venues. The entry gave 168 rows.

158 unique categories were returned by Foursquare for the venue category. So I created a table which shows list of top 10 venue category for each neighbourhood. The head is below

We have some common venue categories in the neighbourhoods. For this reason I used unsupervised learning, K-means algorithm to cluster the neighbourhoods. K-Means algorithm is one of the most common cluster method of unsupervised learning.
First, I will run K-Means to cluster the neighbourhoods into 3 clusters because when I analyze the K-Means with elbow method it ensured me the 3 degree for optimum k of the K-Means.

Here is my merged table with cluster labels for each neighbourhood.

From the result returned when each cluster was analyzed, they can be summarized below.
Cluster One 150 neighbourhoods: “Food & Commerce”
Cluster Two 13 neighbourhoods: “Hotels & Dinner”
Cluster Three 8 neighbourhoods: “Bus stations & Department Stores”
4.0 Results & Discussion
Our analysis showed that although there is a great number of venues in Lagos (1500m radius around each neighbourhood), there are pockets of low density shopping malls across the state. As seen from our analysis, first our data returned 35 shopping malls within only 25 neighbourhoods.
Most of the shopping malls are concentrated around Iponri Housing Estate, Anthony, Victoria Island, Shitta, Pelewura Crescent, Liverpool Rd, Ilupeju, and Alusa. Other areas have negligible presence of shopping malls in the neighborhoods. It opens the door of opportunities for new shopping malls as these areas have very little to no competition from existing malls.
Moreso, in exploring top locations with business activities, Foursquare API returned 1249 venues across all neighbourhoods. The top four occurring venue categories across all neighbourhood are Fast Food Restaurant, Hotel, Bus Station, Banks, and Bars. Clearly showing that these services are in high demand in Lagos, consequently topping the list in occurrence.
Using the k-means unsupervised learning, I also clustered these locations into three different clusters which showed; Cluster One: “Food & Commerce”, Cluster Two: “Hotels & Dinner”, Cluster Three: “Bus stations & Department Stores”.
Furthermore, although we have 1249 venues, there are, however, only 158 unique venue category. While this is quite broad, the number of occurrence however shows a huge gap between the top occurring venues from the rest of the venue category. For instance, while most locations have Fast Food Restaurant, the majority hardly have pharmacies, IT services, Grocery stores, Bookstores, etc.
Therefore, this project recommends that firms should explore other services across each neighborhood to meet the demand in those areas. Companies can also leverage on the clustered data to improve the business services around the top venues.
Finally, real estate developers can capitalize on these findings to open new shopping malls in neighborhoods without one. Realty developers with unique selling propositions to stand out from the competition can also open new shopping malls in neighborhoods with existing shopping malls.
In future studies, the population and age across each neighbourhood could be added to help investors make better decisions.
5.0 Conclusion
In this project, we have gone through the process of identifying the business problem, data extraction, and preparation, performing machine learning by clustering the data into 3 clusters based on their similarities, and lastly providing recommendations to the relevant stakeholders.
The findings of this project will help the relevant stakeholders to capitalize on the opportunities on high potential locations while avoiding overcrowded areas in their decisions to create improved products & services.
References
[2] Forsquare API
[3] Google Map

